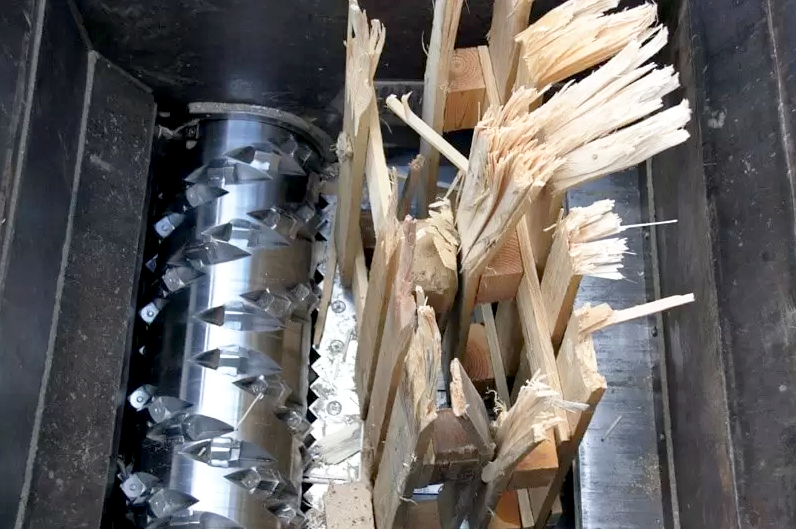
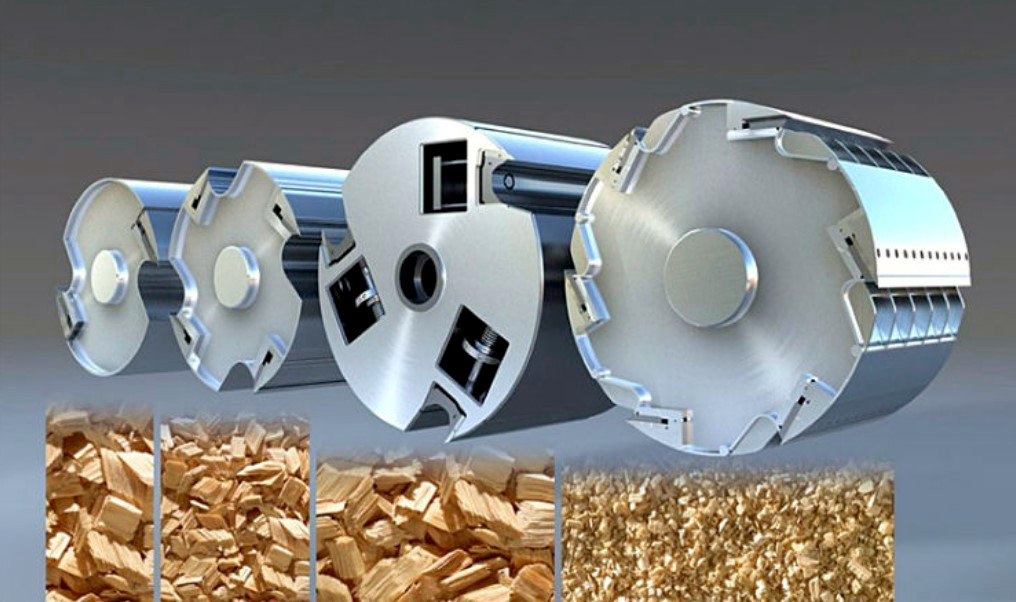
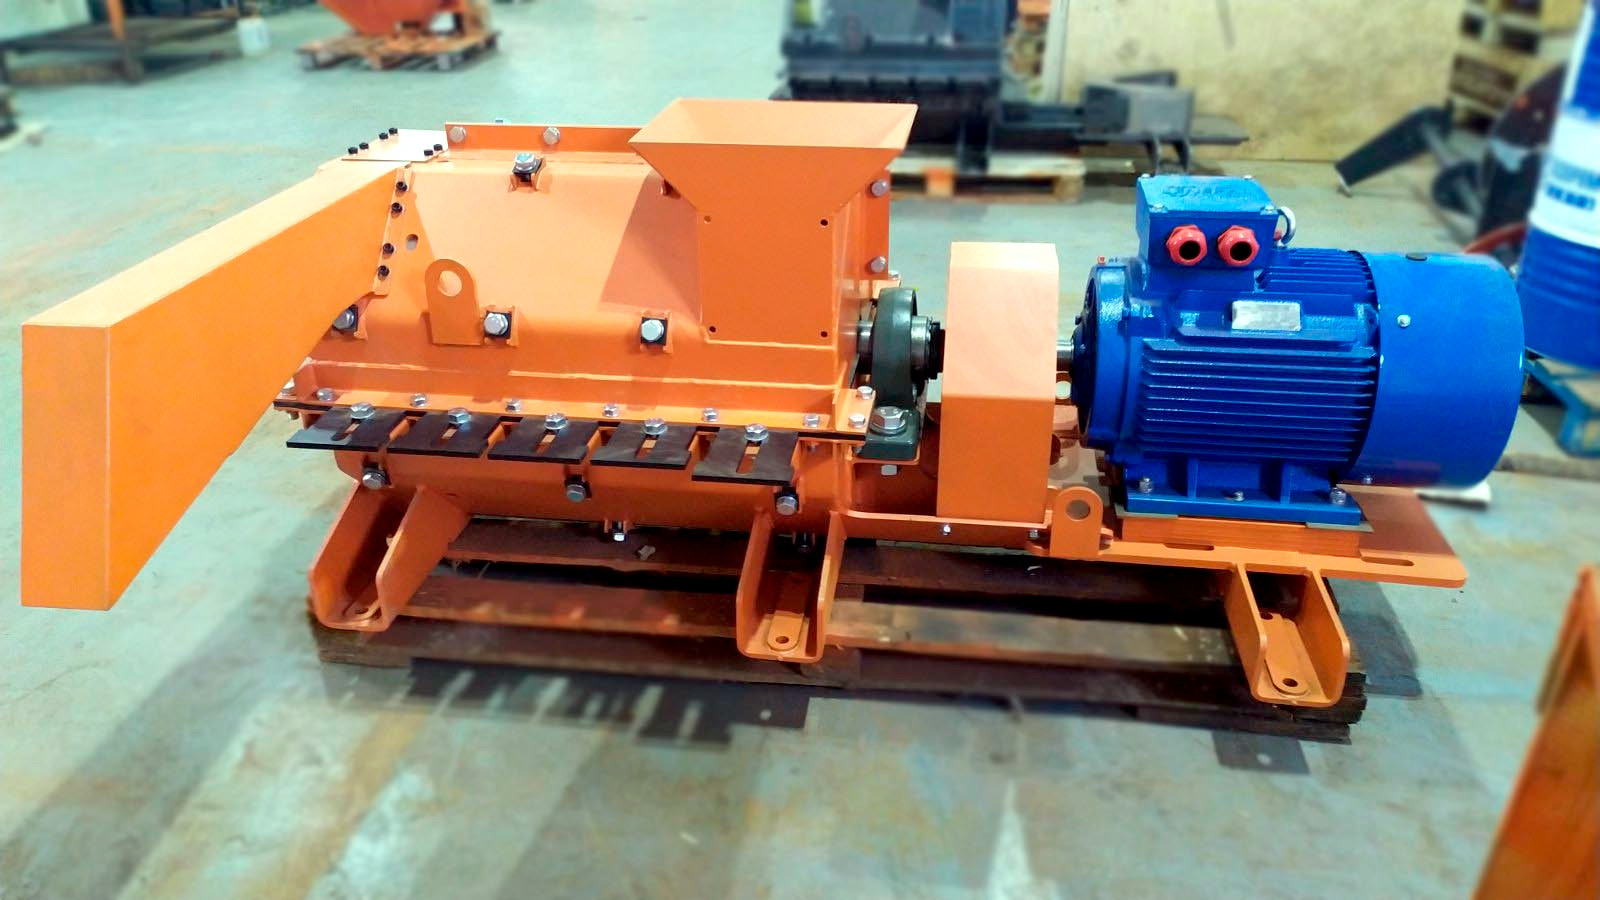
Usually, equipment suppliers already have ready-made specifications for each individual section, such as primary milling, secondary milling, automated sawdust storage, drying complex, pelletizing section, and packaging section. Each section is designed to work with the performance of its neighboring sections. The calculation basis is a narrow range of the optimal productivity of the pellet mill, and then they calculate the necessary reserves. For instance, chippers and shredders are selected with an excess capacity of 1.5-2 times as the raw material may be delivered unevenly throughout the day, and a sudden knife breakdown can cause a stop for several hours. If there are residential areas near the plant, night-time operation will be restricted, and the performance of the chipper should be increased by 3-4 times greater than the plant’s planned productivity.
Drying complexes are calculated for the natural moisture content of green wood at 55% with a standard reserve plus 25% for the low-temperature season or high humidity. The cooler does not need extra reserve since there is hardly an unexpected increase in the pellet mill’s productivity beyond its nominal values. Therefore, they take the upper limit of the press's normal operating range or simply the known maximum productivity for this raw material.
Packaging equipment in semi-automatic operation requires a reserve of 2-3 times because the human factor has a great influence. The least qualified staff often occupy this post, resulting in significant staff turnover. For automatic packaging, a 30-50% reserve is enough to catch up on pace in case of minor issues and always stay slightly ahead of the pellet mill.
Thus, each equipment supplier can provide information on machine options and be conventionally distributed in a price table for each section. Grouping should be done for factories with a similar operating mode, either all around-the-clock or all performance options for single-shift mode.
| Section Name | Productivity, Energy Consumption, and Workers | ||||||||
|---|---|---|---|---|---|---|---|---|---|
| 800 kg/h (1764 lbs/h) | 1500 kg/h (3307 lbs/h) | 3000 kg/h (6614 lbs/h) | |||||||
| Price | kW | Workers | Price | kW | Workers | Price | kW | Workers | |
| Primary Milling | A1 | 55 | 1 | A2 | 100 | 1 | A3 | 180 | 1 |
| Secondary Milling | B1 | 30 | B2 | 45 | B3 | 90 | |||
| Drying Complex | C1 | 20 | C2 | 40 | C3 | 100 | 1 | ||
| Pelletizing | D1 | 75 | 1 | D2 | 150 | 1 | D3 | 300 | 1 |
| Packaging | E1 | 5 | 1 | E2 | 10 | 2 | E3 | 15 | 1 |
| Total Values for Different Raw Materials | |||||||||
| Dry Sawdust | D1+E1 | 80 | 2 | D2+E2 | 160 | 3 | D3+E3 | 315 | 2 |
| Dry Wood Chips | B1+D1+E1 | 110 | 2 | B2+D2+E2 | 205 | 3 | B3+D3+E3 | 395 | 2 |
| Dry Pallets | A1+B1+D1 +E1 |
165 | 3 | A2+B2+D2 +E2 |
305 | 4 | A3+B3+D3 +E3 |
575 | 3 |
| Wet Sawdust | C1+D1+E1 | 100 | 2 | C2+D2+E2 | 200 | 3 | C3+D3+E3 | 415 | 3 |
| Wet Chips | B1+C1+D1 +E1 |
130 | 2 | B2+C2+D2 +E2 |
245 | 3 | B3+C3+D3 +E3 |
505 | 3 |
| Wet Slab | A1+B1+C1 +D1+E1 |
195 | 3 | A2+B2+C2 +D2+E2 |
345 | 4 | A3+B3+C3 +D3+E3 |
685 | 4 |
It is best to fill out the provided table immediately in electronic form with formulas for summing prices, set power, and number of personnel written in the lower part. Add 10-15% to the prices for connecting elements, additional supports, and possible other engineering solutions for integration into the existing building. The same amount should be allocated immediately for equipment installation and commissioning. If the project is built from scratch, consider a multi-storey building made of metal structures. This will save not only the site area but also on conveyors, although it is more applicable to oil extraction or feed production topics.
In general, several interesting observations can be made based on the table:
- The power of the primary milling area grows disproportionately slower because small chipping machines require significant overestimation for peak loads when feeding large logs. This is also reflected in the equipment cost.
- The number of personnel between junior and senior lines differs little, so the labor input per ton of production varies drastically. This is because, at high productivity, automatic packaging and mechanical feeding of bulk raw materials are already applied, although an additional junior operator is required for regular line inspection.
- The specified capacities for the areas may seem too large to some and too small to others. These figures have been tested in practice at many plants where the equipment is actually loaded at an average of 70% of the nominal electric motor power. Thus, a coefficient of 0.7 should be used to calculate electricity consumption. Options for both energy consumption savings and unjustified expansion are possible here.
There is generally nothing wrong if the main drives of the equipment are loaded at just 50-60% instead of 70-80%. When the load on an induction motor exceeds 50%, its efficiency typically goes above 90%. Thus, installing a slightly weaker motor won't provide noticeable savings, but it might decrease operational stability during overloads and force a reduction in the average production rate. It's important not to abuse the buffer of electrical power when a motor with excess capacity is pushed to its limits, risking mechanical failures of gearboxes and working parts. This is a favored self-deception tactic of "highly efficient" managers when they request a larger motor during procurement, force improved warranty conditions in contracts, and then expect to operate at maximum loads consistently, only to be surprised when month after month the target isn't met due to unforeseen repairs.